Maps
Tips and tricks for including basic, interactive maps
- Basic mapping functionality was added into Quire early on but hasn’t been used in production on any projects yet, and so remains very rough. Maps are unlikely to be a supported feature moving forward as they can be very demanding and beyond what we can support for the Quire community at large. In the future, we hope to demonstrate some working examples that can act as a guide if you wish to pursue maps yourself. In the meantime, you’re welcome to make use of the map functionality as it exists but proceed through this section with caution.
Start with an entry in your figures.yml file. It must include media_type: map, latitude (lat) and longitude (long) points to define where you would like your map centered, a src for a static image of your map, and the path to a geojson file. When starting a new Quire project, you will find a sample geojson file in /static/data/sample-geojson.json.
- id: "map"
  lat: 48.8566
  long: 2.3522
  src: figures/map.png
  media_type: map
  geojson: /data/sample-geojson.json
  caption: "Great cities in France."
Geojson data is what powers the marked points, regions, and labels on your map. There are several tools for creating and editing it and sites to help you understand it. Quire uses Leaflet as a map viewer, so some of their documentation should be applicable here. The only thing we’re demonstrating in the current, basic mapping functionality are marking points and adding a pop-up to them with some text.
Basic geojson:
{
  "type": "FeatureCollection",
  "features": [
    {
      "type": "Feature",
      "geometry": {
        "type": "Point",
        "coordinates": [2.3522, 48.8566]
      },
      "properties": {
        "name": "Paris",
        "description": "The city of lights"
      }
    }, {
      "type": "Feature",
      "geometry": {
        "type": "Point",
        "coordinates": [1.map-inlinemap-inline4695228, 48.4481021]
      },
      "properties": {
        "name": "Chartres",
        "description": "Southwest of the city of lights"
      }
    }
  ]
}
Once you have your entry in figures.yml and it’s pointing to your geojson data, you can add a map to the page with the q-figure-zoom shortcode:
{{< q-figure-zoom id="map" >}}
The result is a figure image with the static map image and any provided caption, which can be clicked on to open the full, interactive map with zooming and your marked geojson points.
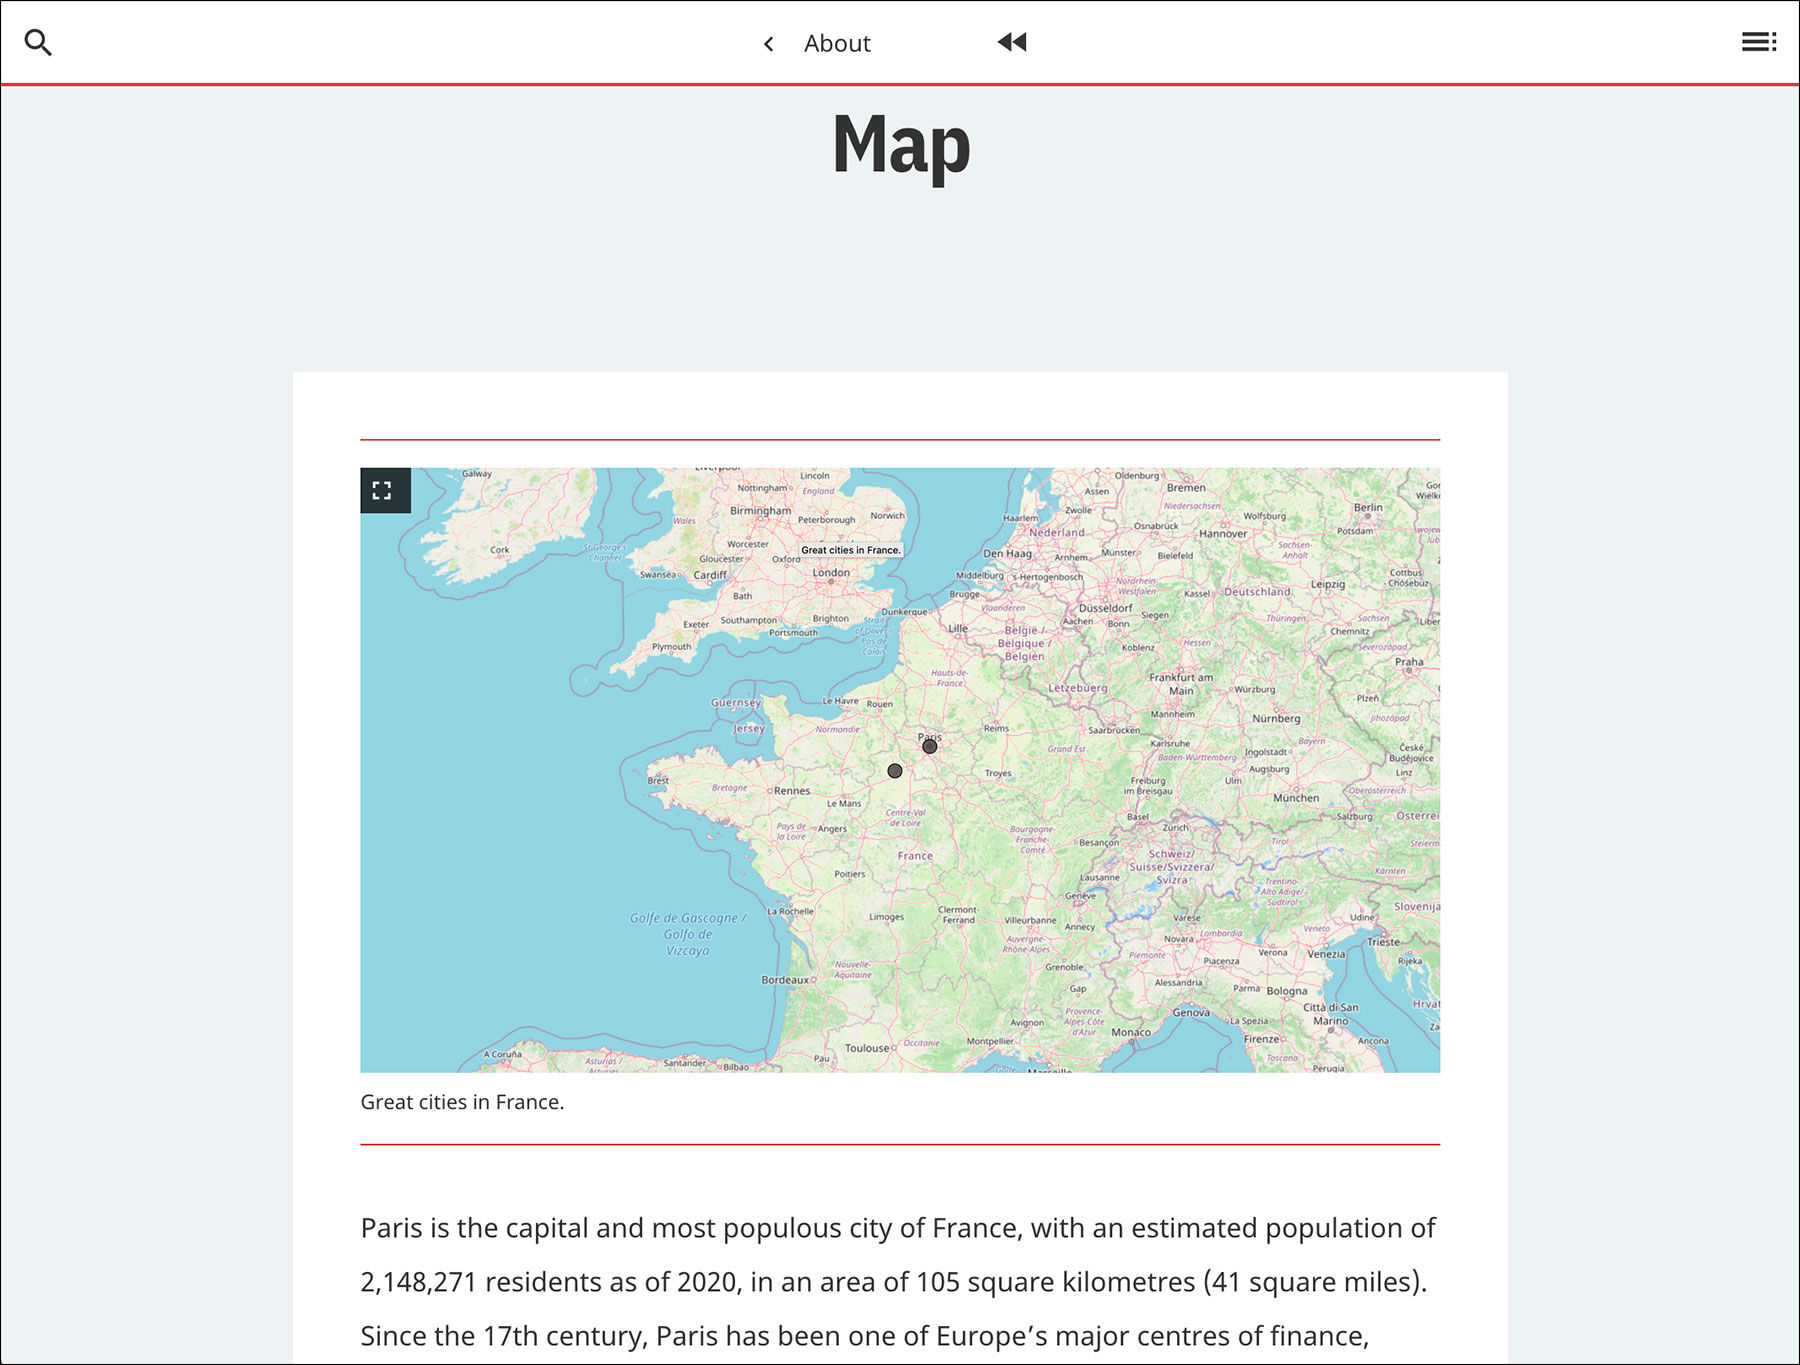
{% figure-zoom %} shortcode, it will display a static image of the map when you’re on the page.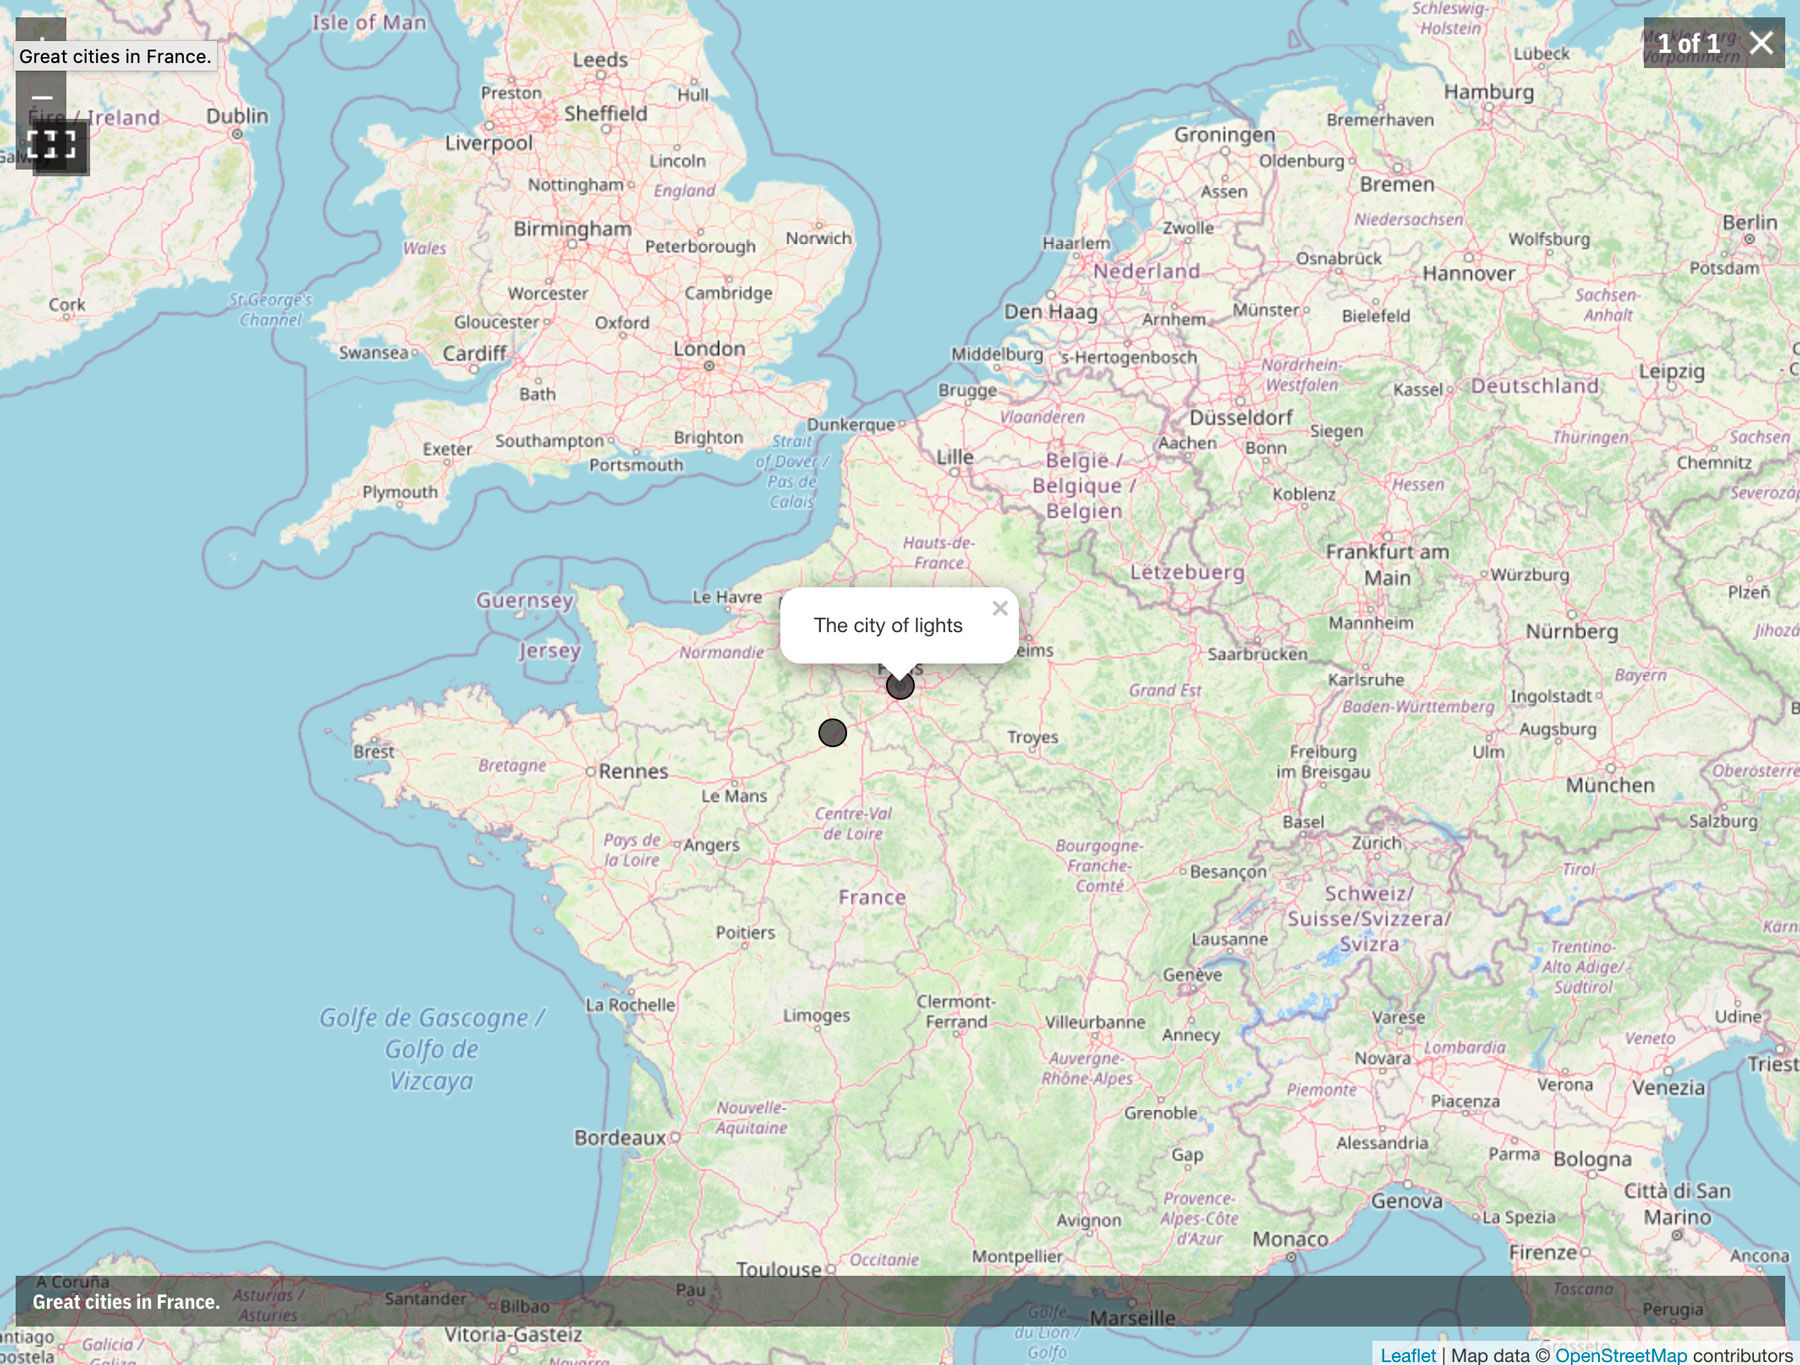
{% figure-zoom %} shortcode, it will load an interactive version centered on latititue and longitude points you specified, and displaying labels and points from your geojson data file.You’ll see there are some issues with the interface here (such as the duplicated full screen icon in the upper right), and the city labels we included in the geojson for Paris and Chartres are not included on the map points, nor as part of the pop-up label.
The map is fully zoomable and global. The open-source images come from OpenStreetMap. Just note that this is an external resource to your Quire project and is subject to change within your publication over time as OpenStreetMap updates its maps or changes its service.
For the advanced user, it is possible to further configure your map, and potentially point to different map image tiles in /themes/default/source/js/map.js.